
Reports
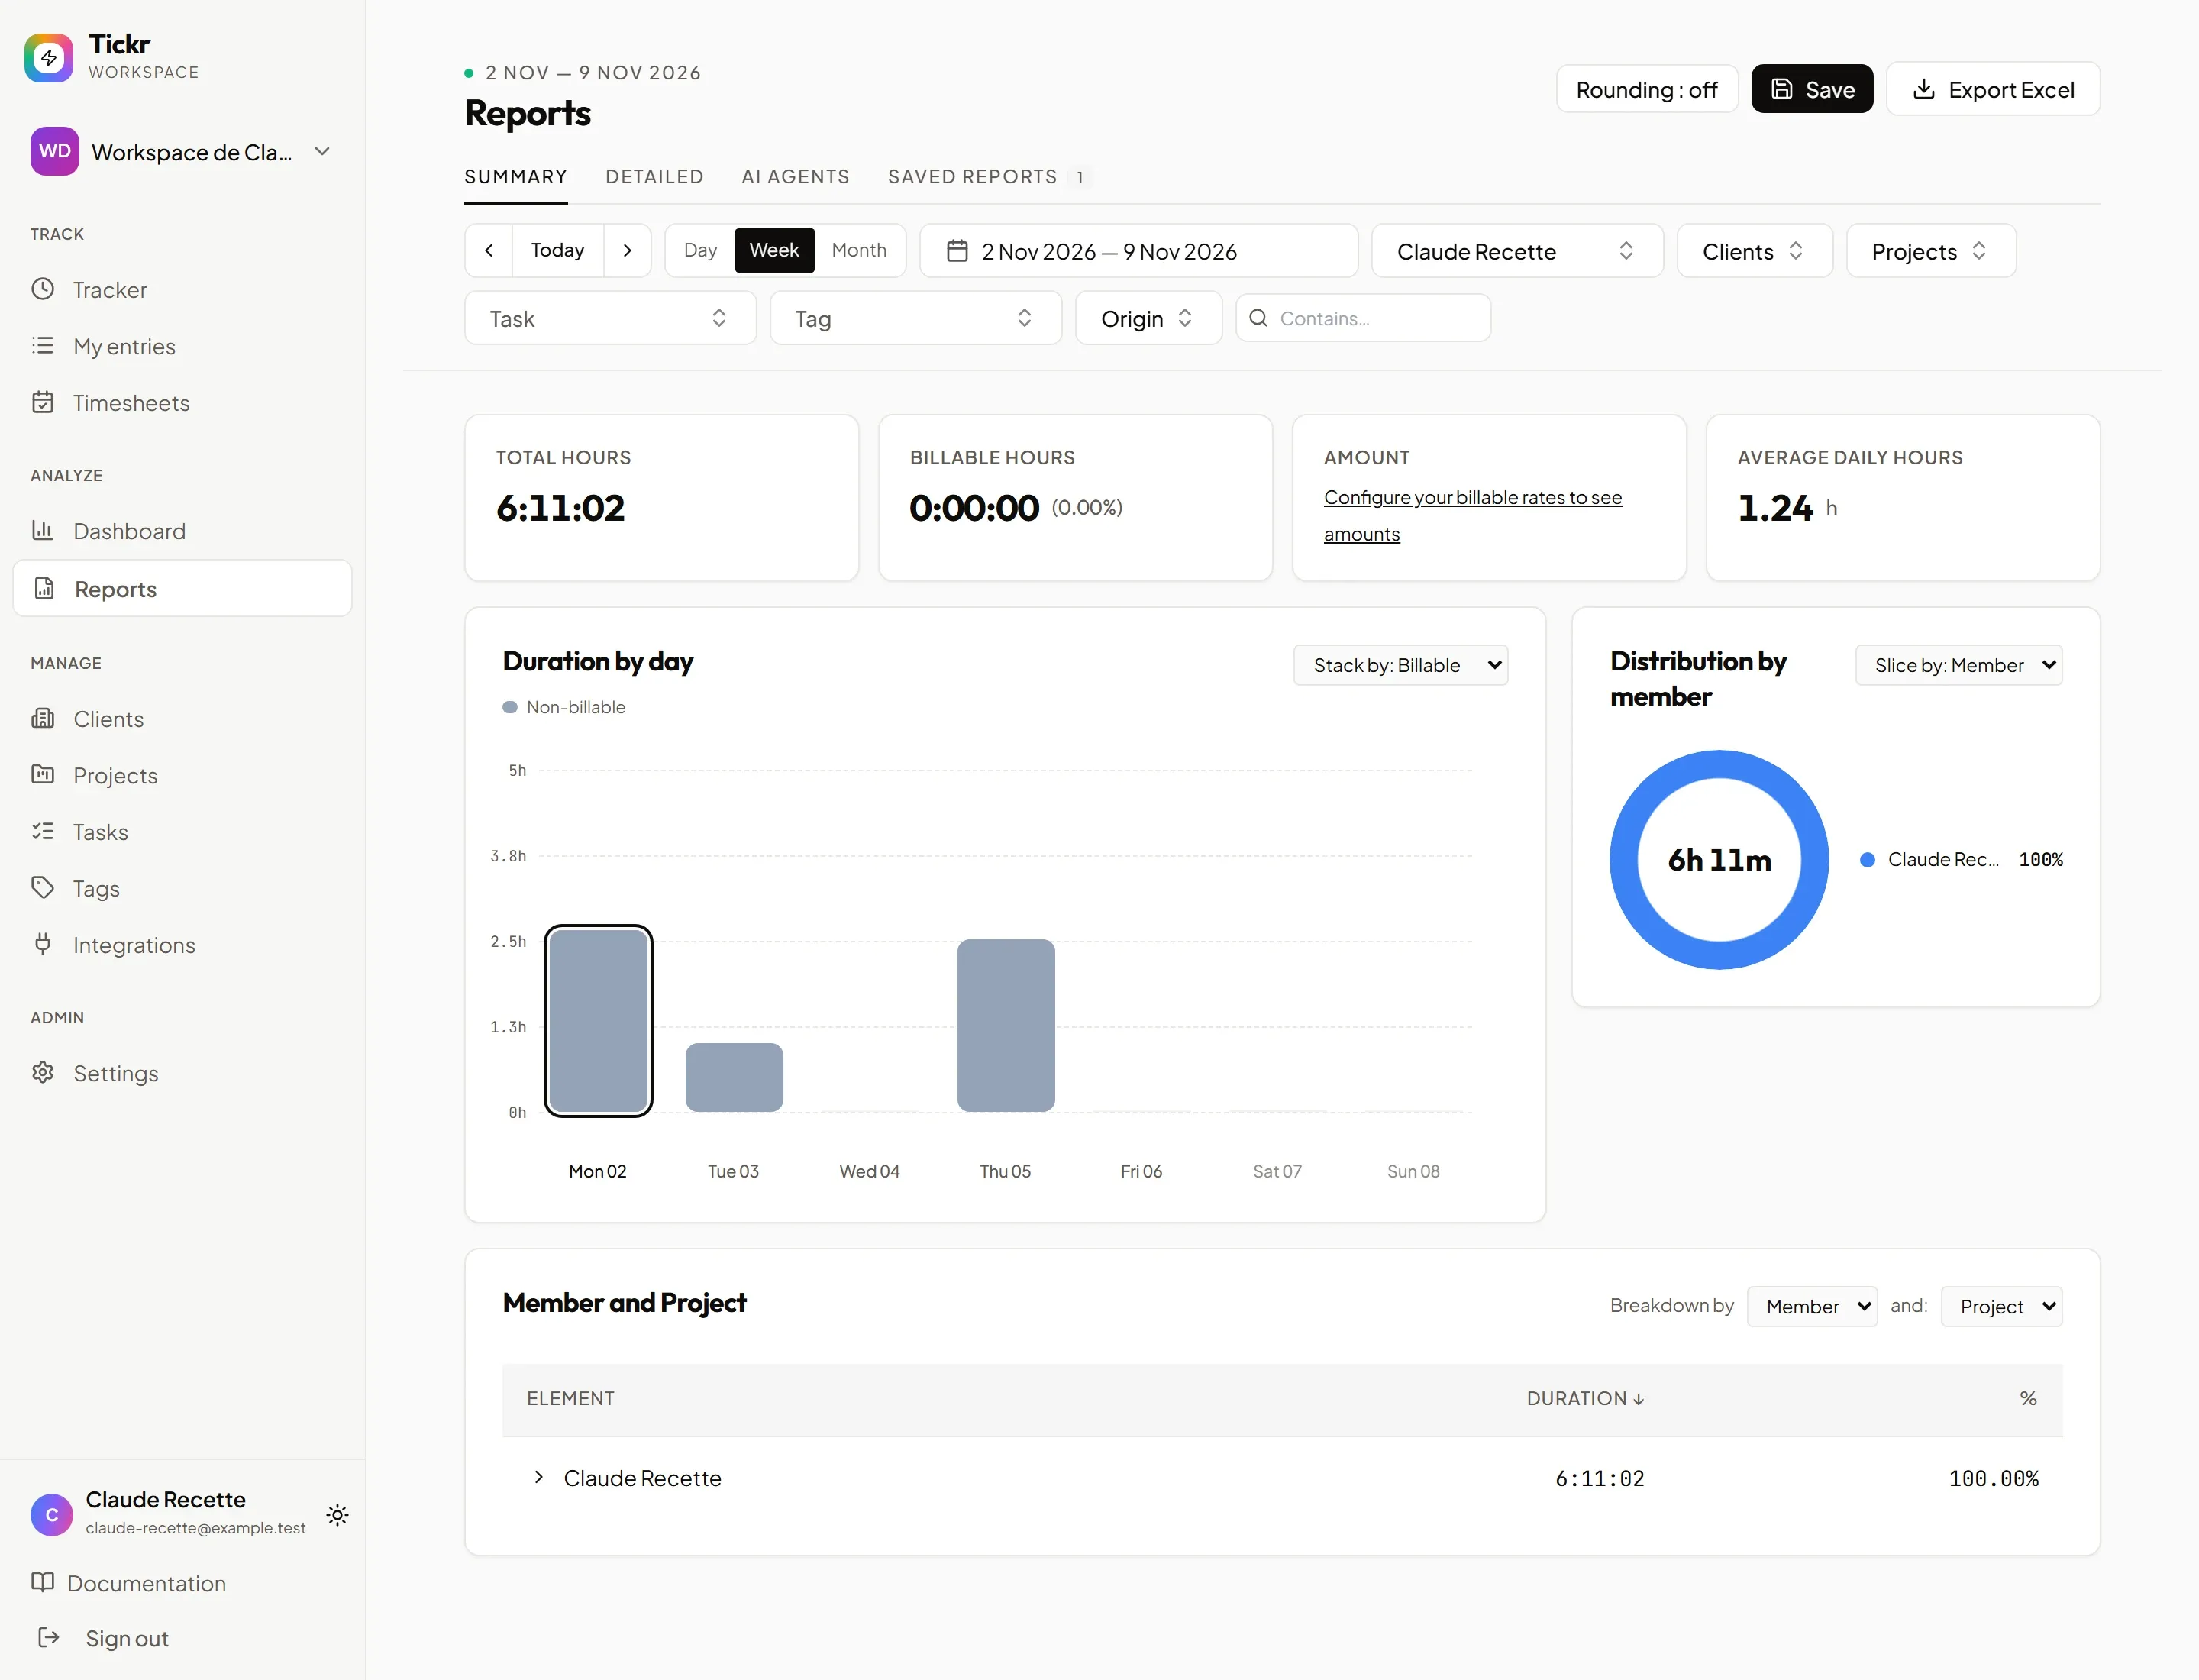
The Reports page (Analyze section) goes further than the Dashboard: the same filters, more ways to cross the data, optional rounding, the Excel export and saved reports you reopen in one click.
Four tabs
Section titled “Four tabs”- Summary — indicators, duration per day and distribution.
- Detailed — the list (or calendar) of the period’s entries, with the New button to add one.
- AI agents — agent activity: see AI agents.
- Saved reports — your saved reports and the ones other members shared (the counter shows how many).
Filters
Section titled “Filters”The filter bar is shared by the four tabs:
- Period: previous / next buttons around Today, Day, Week or Month, or a custom date range;
- Member, Clients, Projects, Task, Tag;
- Origin (web, API, agent, calendar, imports…);
- Contains…: searches the entries’ description.
A Workspace User only sees their own entries; Analyst, Project lead, Admin and Owner see the entries in their role’s scope.
Summary tab
Section titled “Summary tab”- Indicators: total hours, billable hours, amount (shown only once billable rates are configured, and never to a Workspace User; an Analyst sees the total amount but not the per-row amounts of the breakdowns) and average hours per day.
- Duration by day: a histogram you stack by billable, project, client, tag or member (Stack by).
- Distribution: a ring by member, project, client, tag or billable / non-billable (Slice by).
- Cross-tab: Breakdown by a first criterion and a second one (member, project, client, tag); expand a row to see the next level.
Rounding
Section titled “Rounding”The Rounding button (top right) rounds the displayed and exported durations: choose the grain and the mode (Nearest, Up, Down). Off by default. The durations in the agent reports stay raw, unrounded.
Export
Section titled “Export”Export Excel exports the entries of the active filters (members, description and rounding included). On the AI agents tab, the export is limited to agent entries and adds ten columns (origin, agent, version, session, counts as work time, usage quality and four token sums), placed after the usual columns.
Save a report
Section titled “Save a report”Save keeps the current filters, period and tab under a name (unique, 120 characters at most). In the dialog:
- Period mode: relative (“this week”, “this month”: the report follows time) or absolute (fixed dates);
- Share in the workspace: other members see it under Shared by other members;
- Default tab when loaded.
From the Saved reports tab, a report’s (⋯) menu offers Load, Duplicate, Share / Unshare and Delete. A loaded report reopens on the tab it was saved from (Summary, Detailed or AI agents) and keeps its period mode. When you change a filter, the report is flagged modified; Save → Update or Save as new… keeps the change. Renaming is coming in a later version: duplicate in the meantime.